Intel's May Survey: What the Interactive Dashboard Reveals About Today's Real Estate Market
The real estate industry thrives on data. Agents, brokers, and market analysts are constantly searching for reliable, up-to-date information that helps them make smarter decisions, serve clients better, and position their businesses for long-term success. Intel's May survey delivers exactly that — a comprehensive, data-driven look at the current state of real estate through the eyes of the professionals who live it every day. Using a dynamic interactive dashboard, users can explore, filter, and analyze results from real estate agents and brokerage leaders across the country, broken down by region and brokerage type, while also tracking historical trends over time.
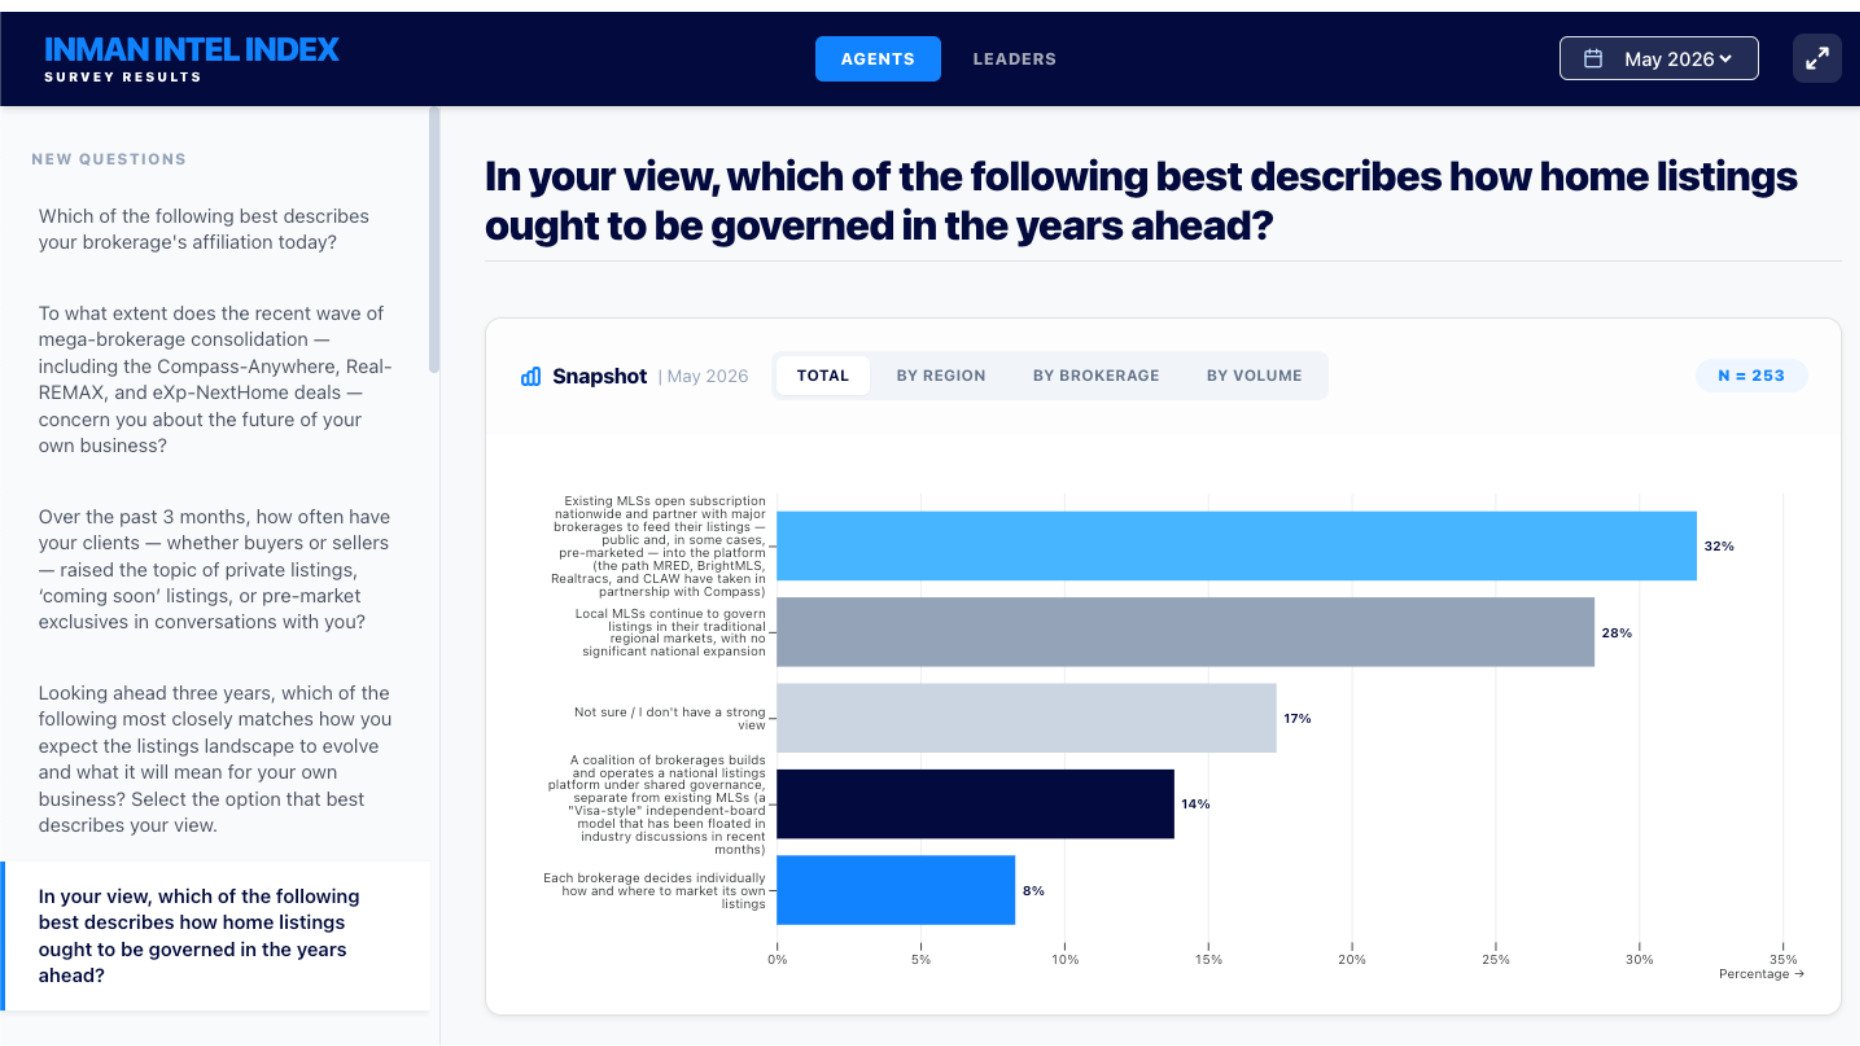
What Is the Intel Real Estate Survey?
Intel conducts ongoing surveys of real estate professionals — including frontline agents and senior brokerage leaders — to capture a ground-level view of market sentiment, operational challenges, and industry shifts. The May edition of this survey represents one of the most timely and actionable datasets available to real estate professionals in 2025. Rather than presenting findings in a static report, Intel offers an interactive dashboard that empowers users to slice and analyze the data themselves, drilling down into the metrics that matter most to their specific market or business model.
This approach to data presentation is significant. Static reports quickly become outdated and often fail to serve the diverse needs of a broad readership. An interactive dashboard, by contrast, allows an independent agent in the Southeast to compare her market sentiment against peers in the Midwest, or a large national brokerage to benchmark its leader sentiment against smaller boutique firms. The result is a richer, more personalized understanding of industry trends.
Exploring the Data: Regional Breakdowns
One of the most valuable features of Intel's May survey dashboard is its regional segmentation. The real estate market is famously local, and what holds true in one region may tell a completely different story in another. By breaking down survey results by geographic region, Intel enables users to identify where sentiment is rising, where it is falling, and where unique market conditions are driving divergent outcomes.
For example, agents in high-demand urban markets may report very different levels of buyer confidence compared to those operating in rural or suburban areas. Regional breakdowns help professionals contextualize the national narrative and apply data insights to their own geographic realities. Whether you're tracking listing inventory concerns, commission structure pressures, or technology adoption rates, the regional filter provides clarity that a one-size-fits-all report simply cannot offer.
Brokerage Type Analysis: Independent vs. Franchise vs. National Brands
Alongside regional filters, the Intel dashboard allows users to sort and compare data by brokerage type. This is particularly valuable for brokerage leaders who want to understand how their organization's sentiment and performance metrics stack up against similar businesses. The real estate brokerage landscape is diverse — it includes everything from solo independent operations and regional boutique firms to large franchise networks and major national brands.
Each brokerage type faces its own set of challenges and opportunities. Independent brokerages may be navigating technology investment decisions without the infrastructure support of a larger network. Franchise operations may be managing national brand mandates alongside local market realities. National brands may be focused on agent recruitment and retention in a competitive environment. Intel's survey captures these nuances, and the dashboard's brokerage type filter makes it easy to compare apples to apples rather than drawing misleading cross-category conclusions.
Tracking Historical Trends Over Time
Perhaps the most powerful capability of Intel's interactive dashboard is its historical trend tracking. Point-in-time data is useful, but longitudinal data tells a story. By comparing May's results against previous survey waves, users can identify whether agent confidence is improving or deteriorating, whether specific pain points are becoming more or less acute, and whether market conditions are trending in a direction that warrants strategic action.
Historical trend data is especially valuable for brokerage leaders who need to make long-range planning decisions. If survey data consistently shows that agents in a particular region are struggling with lead generation, that signal can inform training investments, technology procurement, or marketing strategy. If brokerage leader sentiment around profitability has been declining over several quarters, that trend demands attention at the executive level. Intel's dashboard makes these trend lines visible and interactive, allowing users to zoom in on specific time periods and compare across multiple survey cycles.
How Real Estate Professionals Can Use This Dashboard Effectively
Getting maximum value from Intel's May survey dashboard requires a clear sense of purpose. Here are several ways real estate professionals can put the data to work:
- Market benchmarking: Use regional and brokerage type filters to compare your own team's sentiment and performance perceptions against comparable peers in the industry.
- Strategic planning: Identify emerging trends in agent feedback that may signal shifts in training needs, compensation structures, or technology requirements before they become critical issues.
- Client communication: Draw on verified survey data to support market conversations with buyers and sellers, demonstrating professional knowledge backed by industry research.
- Recruitment and retention: Understand what agents across different brokerage types and regions are prioritizing, and use that insight to refine your value proposition for talent acquisition.
- Advocacy and leadership: Brokerage leaders and association professionals can use aggregated trend data to support policy conversations or industry-level initiatives grounded in real professional sentiment.
Why Intel's Approach to Real Estate Data Matters
In an industry where anecdote often masquerades as data, Intel's commitment to structured, surveyed, and interactive research is a meaningful differentiator. The May survey isn't built on algorithm-generated estimates or speculative modeling — it reflects the actual opinions and experiences of real estate agents and brokerage leaders working in today's market. That authenticity gives the data credibility and makes the insights actionable in ways that secondary market data often cannot match.
Furthermore, by making the dashboard interactive and continuously updated with historical comparisons, Intel ensures that the data remains relevant beyond the initial publication date. Users can return to the dashboard across months to track how sentiment evolves as market conditions shift, interest rates fluctuate, and regulatory changes take effect. This ongoing utility transforms Intel's survey from a one-time read into a living resource for real estate professionals seeking a data edge.
Conclusion: Data-Driven Decision Making for a Changing Market
Intel's May survey interactive dashboard represents a significant resource for anyone operating in or adjacent to the real estate industry. By offering granular regional breakdowns, brokerage type segmentation, and historical trend tracking through an intuitive interactive interface, Intel empowers agents, brokers, and industry leaders to move beyond guesswork and make decisions grounded in real professional sentiment. As the real estate market continues to navigate a complex economic environment, tools like this dashboard are not just helpful — they are essential. Explore the data, track the trends, and let the numbers guide your next move.